CQM_EfP

CQM_EfP is an easy-to-use software tool for effective statistical analysis in process and product improvement and (re)design. It is particularly well suited for the statistical analyses used in Lean Six Sigma (DMAIC) and Design for Six Sigma (DfSS/DIDOVM).
CQM_EfP is an Excel add-in. This means that when your data is already in Excel, you can perform a statistical analysis with just a few clicks and one or two cell references. The output of each analysis includes charts and statistics that summarize your data, with a strong emphasis on visual interpretation.
CQM_EfP includes techniques for the most common statistical challenges. We have selected appropriate default settings for statistical techniques that can be applied across a wide range of situations. This makes it easy to apply the right technique without having to learn the specific commands or terminology of specialized statistical software.
Because the output is standardized and easy to interpret, results can be used directly in reports.
Key benefits:
- User-friendly
- Analysis directly within Excel
- No need to learn specialized statistical software
- Easy to use, interpret, and communicate results
- Applicable to a wide range of technical challenges
- Straightforward software for Six Sigma applications
- Visual presentation of results and practical guidelines for interpretation
- Standardized reporting output
- Low cost
The tools:
- Critical Parameter Sheet / CTQ Flow Down
- Reporting Formats for Process Capability Summary Sheet and FMEA
- Risk Plot
- Pareto Analysis
- Data Screening
- Measurement System Evaluation
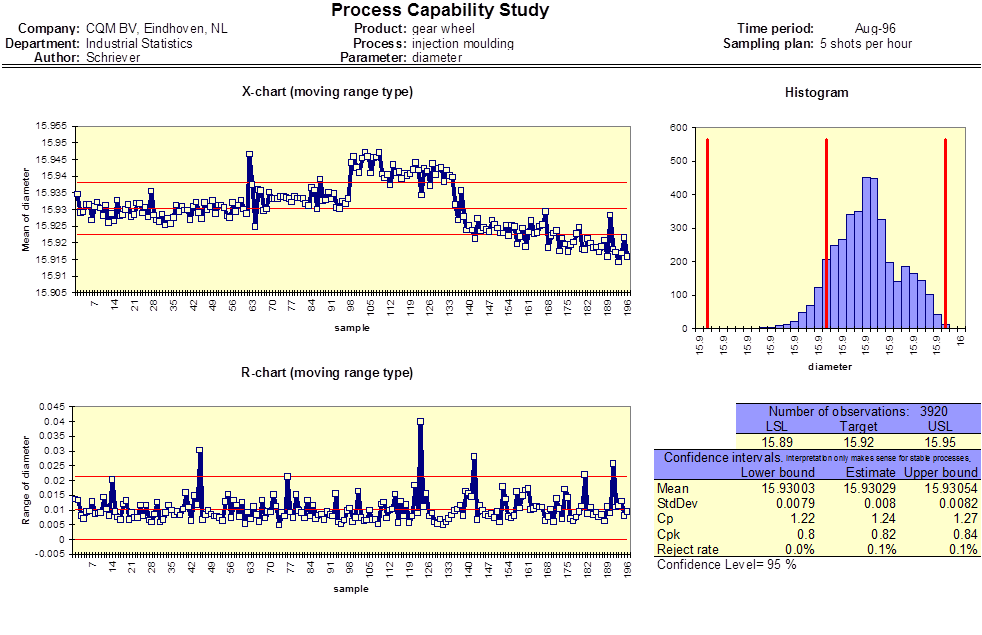
- Process Capability Study
- Histogram
- Control Charts
- Multiple Comparison
- Scatter Plots
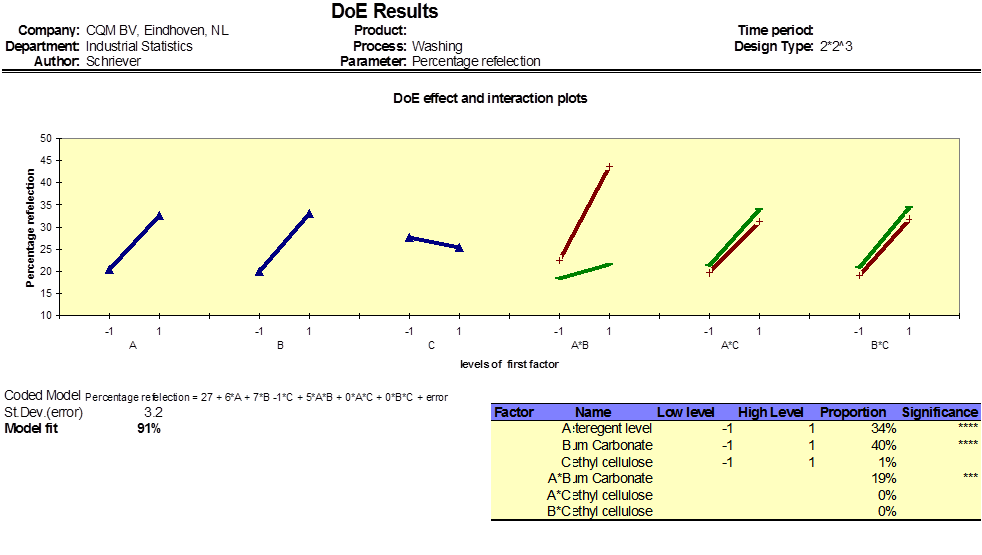
- Design of Experiments
- Variables Search
- Sample Size Determination

Want an easy way to perform statistical analyses in Excel?
Get in touch to learn more about CQM_EfP.